Explainer: Responses Page
Introduction
The Responses Page is where you will manage all of your survey responses in SurveyOptic. Here you will find a collection of tools that will allow you to do the following things:
- View summary information about the number of responses you have
- View individual responses row-by-row
- Delete test responses
- Analyse the performance of your survey in terms of response rate, response fall-offs and respondent sources
- Re-code answer choices for easier analysis
- Theme open text questions using tagging
- Import additional responses such as those completed on pen and paper
Once a survey has begun to receive responses, the [Responses] button appears on the survey "tile" in the Surveys and Survey Summary pages. Alternatively, you can select Responses at any point to be taken to the Responses page. If you already have a survey open, for example in the survey editor or Reports page, this survey will be open when you arrive on the Responses page. If you don’t have a survey open, when you visit the Responses page, you will see a list of surveys with responses and a [View Responses] button.
Tabs
Once on the Responses page, you will see a series of tabs underneath your survey title. When opening the Responses page, the first tab to open will depend on the status/stage of the survey. This document will discuss the purposes of each tab, with a particular focus on the Responses tab.
Questions tab
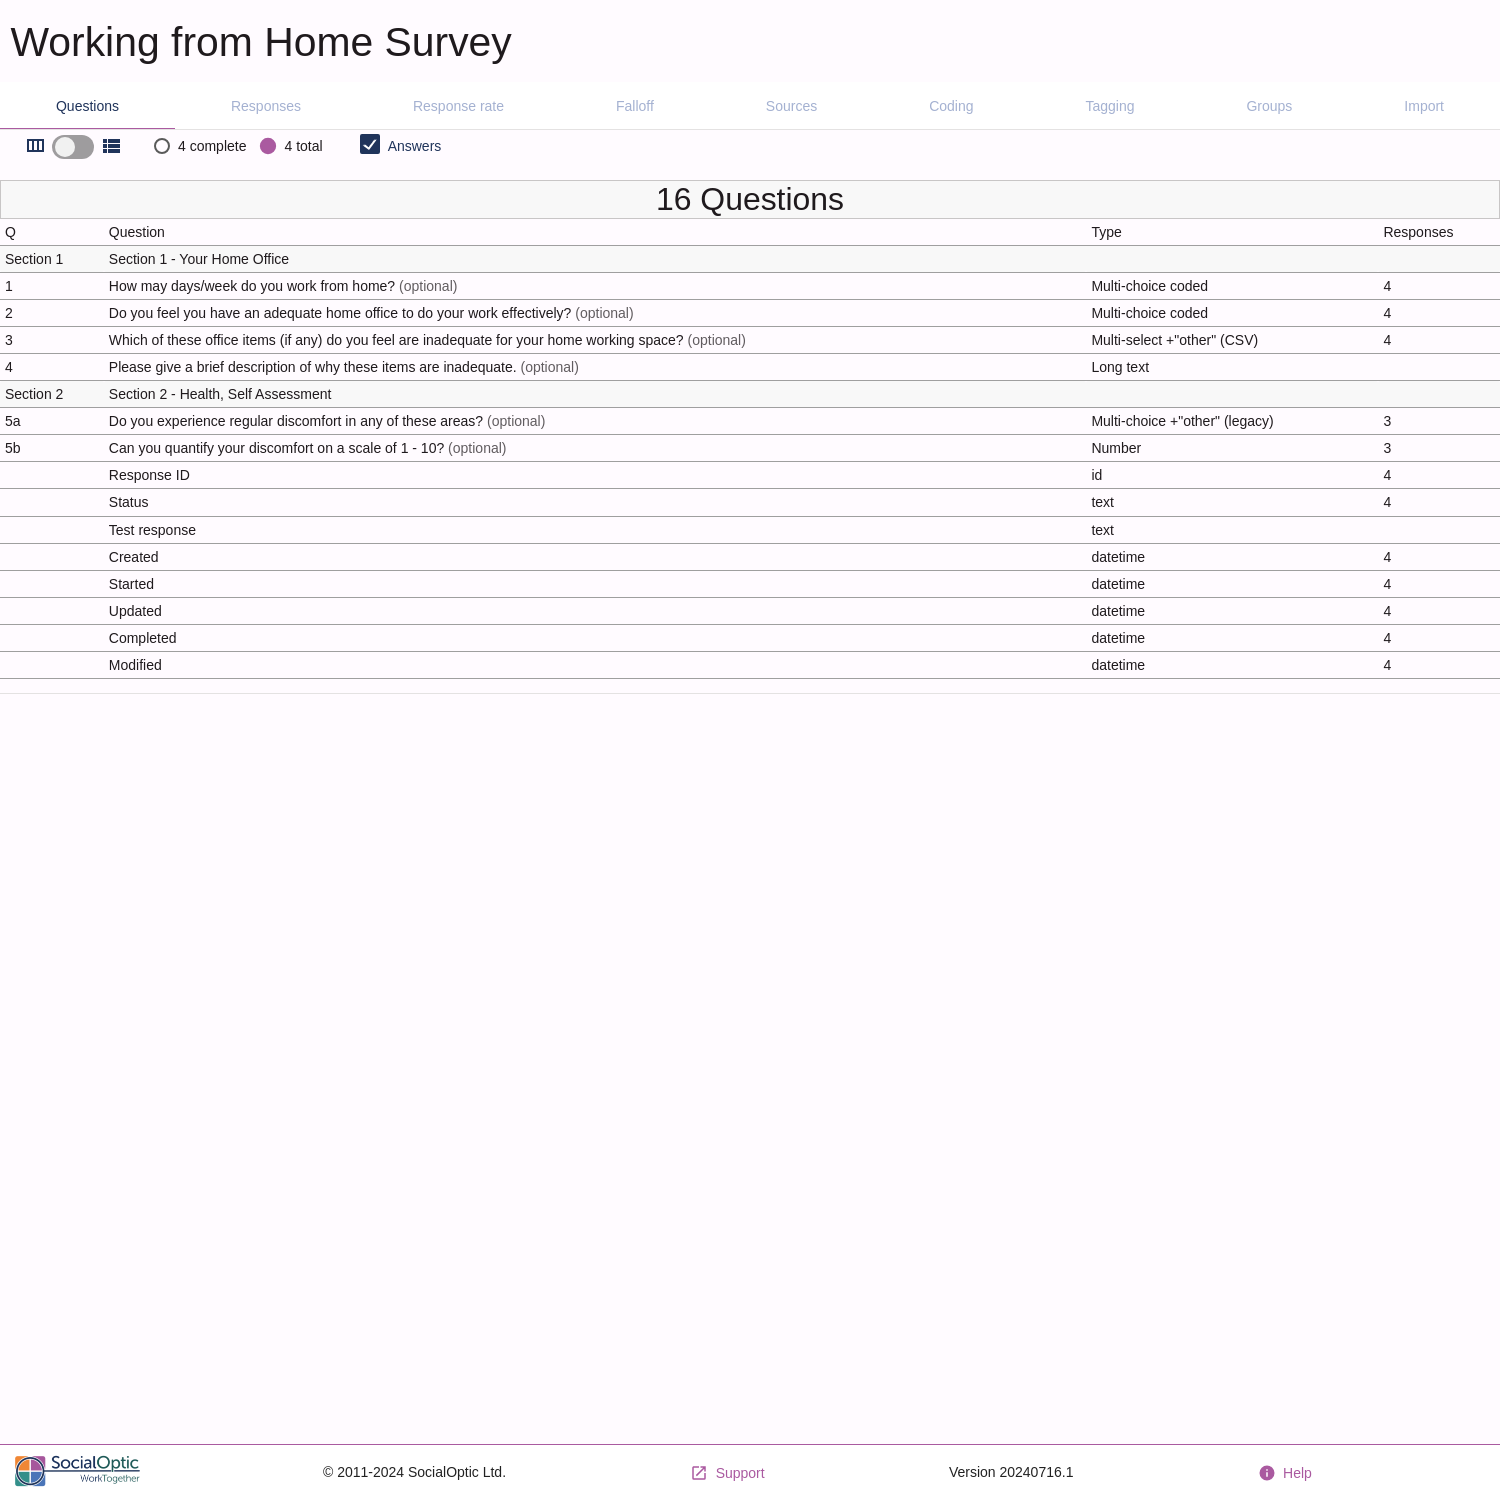
The Questions tab displays your survey questions divided by section. For each question the question number, text, type and number of responses are listed. Clicking on the toggle button in the menu bar reveals a more detailed view.
Responses tab
Once a survey is closed, the Responses page will open on the Responses tab by default. Displayed here is a table detailing all the responses to the survey, including answers as well as important date stamps.
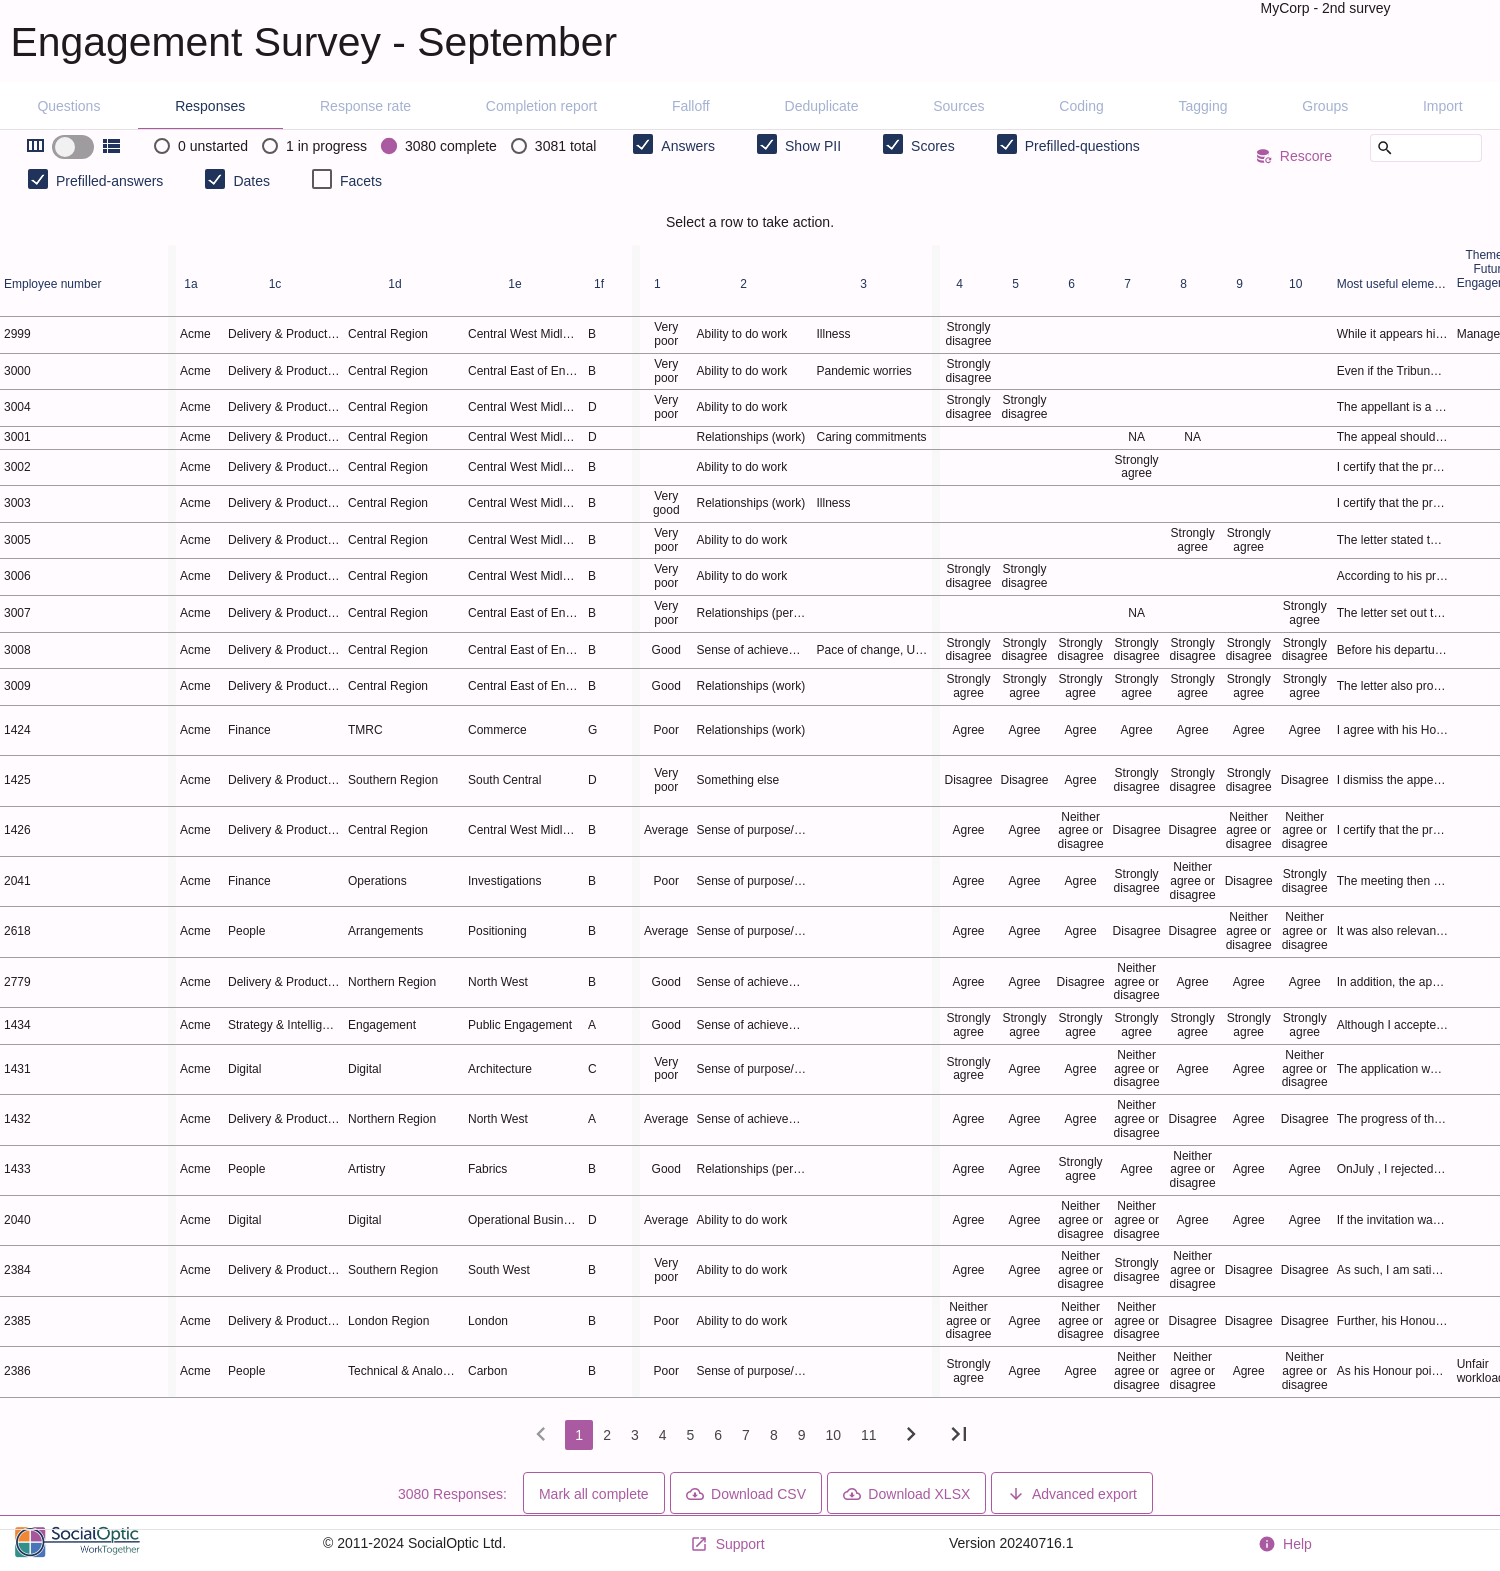
The table
Within the table, you’ll find the following columns:
Numbers 1 – X : the survey questions, ordered by question number. Any unnumbered questions will be labelled with a letter such as 1a, 1b etc. Sections are denoted by grey vertical lines.
Response ID : a unique respondent ID assigned to the response.
Scores : columns will be displayed for any scores that have been set-up in the survey.
Variables : additional data about a response such as whether it has been exited.
Created : timestamp when the respondent first visited the survey OR when their response was imported (if conducting an email invite survey for example).
Started : timestamp when the respondent started the survey.
Status : appears when using "approval flows". Displays the current status of the response in reference to its approval status ("approved"/"rejected"/"pending") or exit status ("exit").
Updated : timestamp when the respondent last submitted an update, usually by clicking the next button in the survey.
Completed : timestamp when the respondent submitted the response.
Modified : timestamp when the system or an administrative user last made a change to the response. Such as re-opening or closing the response, or any other modification to the data.
The table is sorted by Updated date by default (newest first). The table can be sorted by any column of your choosing by clicking on a column title. Clicking again will reverse the order. Date fields (completed, started, ...) are sorted in chronological order, text fields are sorted in alphabetical order.
The answers to questions are displayed in a variety of ways depending on the type of question. Hovering over any of the elements in the table will reveal further detail, such as the question text.
The toolbar
Above the table there is a toolbar displaying a collection of buttons, data and a search bar. Some are contextual and will only appear when relevant. All of these are described below:
Table XY toggle : flips the table to an alternative view, switching between one response per column and one response per row .
Maximum : the maximum number of respondents as set in the survey editor. In the case of importing responses, this number will reflect the number of imported responses.
Unstarted : the number of invited respondents who have not started the survey (seen in email invite surveys). Clicking here will filter the table, showing only "unstarted" responses.
In Progress : the number of respondents who have partially completed the survey. Clicking here will filter the table, showing only "in progress" responses.
Complete : the number of responses submitted to the survey. Clicking here will filter the table, showing only "complete" responses. Please not that if a survey uses "optional" questions, completed responses may include responses that do not have answers to all questions.
Total : the total number of "unstarted", "in progress" and "completed" responses.
% Complete : the percentage of survey response completion, when compared to the "Maximum".
Answers : show/hide the answers in the table.
Show PII : show/hide any PII in the table. By default, this is set to hide upon opening the page.
Prefill-Question : show/hide the Prefill-Questions.
Prefill-Answer : show/hide the Prefill-Answers.
Facets : enable "Facets". The table can be filtered by question answers using facets. Once enabled, select [+] to begin adding facet filters, choosing the question and question answer you would like to filter by. For example you may wish to only view responses of respondents from a particular department, or age group. You can add multiple fields to narrow your search.
Dates : show/hide the date columns.
Search : search/filter the table using this search bar. Particularly useful for finding specific respondents through the unique response ID or their name if that field was part of your survey. Please note, for date searches months are stored numerically eg: 2021-01-13. A word search for Jan or January will not yield results in the date fields.
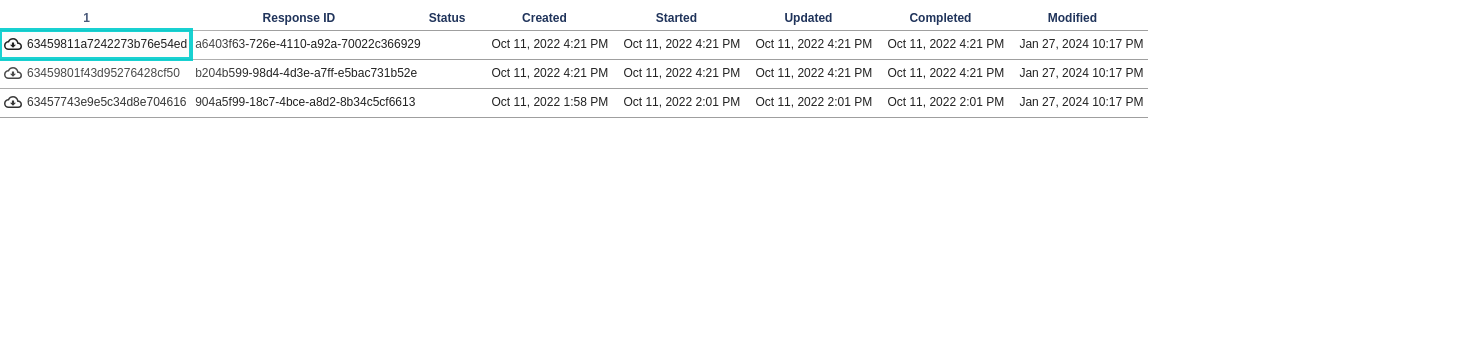
Files button : show/hide file upload questions. All uploaded files are assigned a unique ID which will be listed. These ID's can be searched for and clicked on for download. Below is an example file upload question as seen in the responses page.
If at any point you can't see the data you are expecting, it is worth checking your active filters.
Other tools
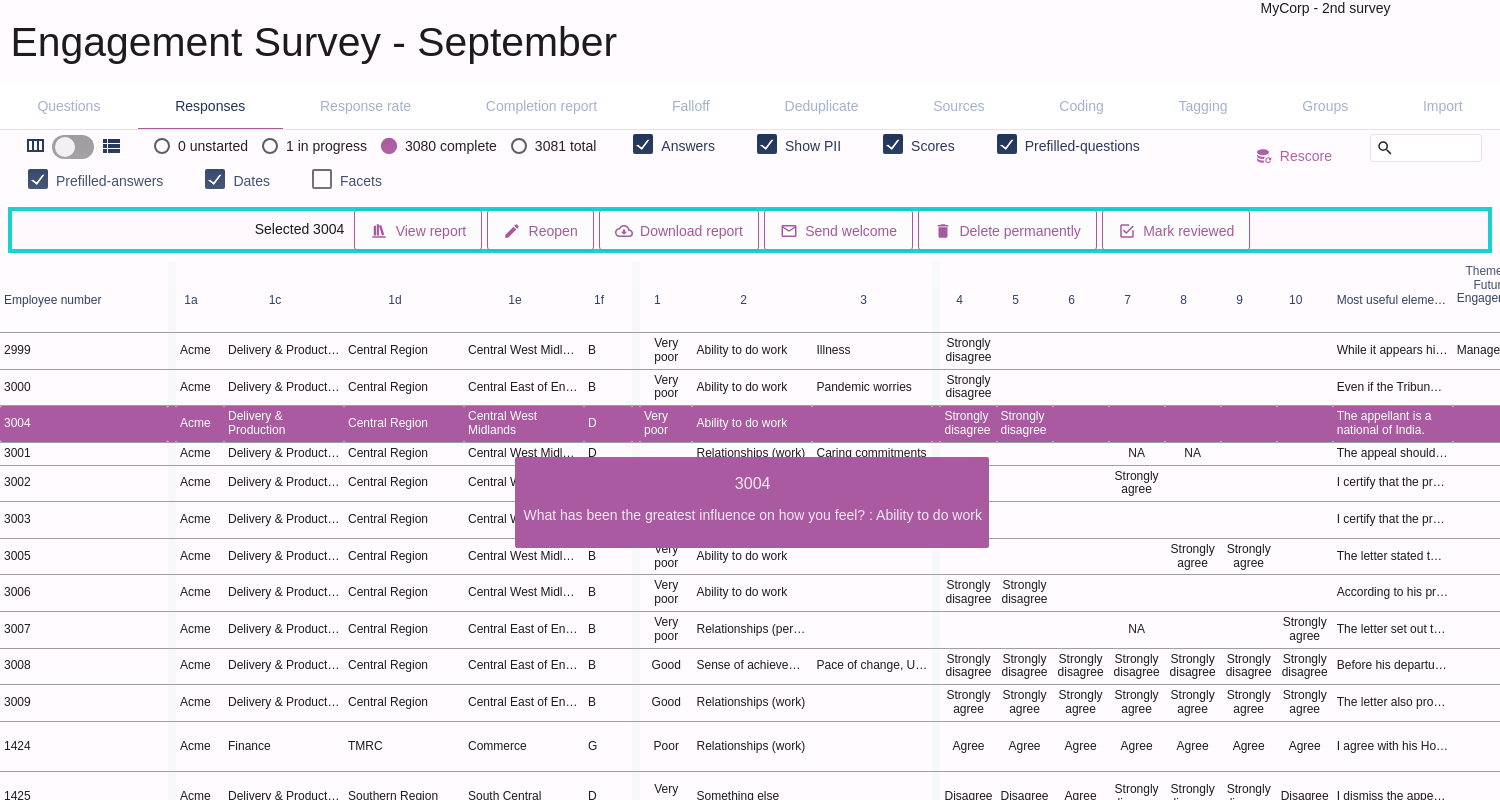
Action bar : a response can be selected by clicking on it. Once selected a menu of action buttons will display above the table. Actions displayed are contextual to the state of the response and how the survey is set-up. Example actions include removing a response, reopening a response, un-marking a response as test, and some contextual actions such as reminder emails if set-up.

Below the table, you will find a few more controls. Many of these are contextual and will only appear when relevant:
Page numbers : navigate between pages using the page numbers or the arrow buttons.
Responses Counter : shows the total number of responses that are captured by the current filter settings.
Email Buttons : send respondent emails in bulk if set-up. This function is sensitive to any active filters.
Mark all Complete : mark any "in progress" responses as complete. This will include the answers of these responses with the rest of the responses for analysis. Useful where you have near complete responses which will add relevant data to your analysis. This function is sensitive to any active filters. We recommend checking closely before using this function to avoid any unwanted data being marked as complete.
Download CSV : download a CSV file containing the responses currently displayed. The download will de-code all relevant answers to human readable text. This function is sensitive to any active filters. The export will also follow the ordering selected in the table (i.e. ordering by column).
Uncontactable : download a CSV file containing any responses which have invalid contact details. This function is sensitive to any active filters.
Section Filters : Filter the table by using section tabs under the page numbers. This will filter the table to show only the questions included in the selected section.

Response Rate
The Response rate tab displays a completion chart, detailing survey responses over time. This can be a useful tool for tracking responses and in particular, the impact of any communications push for the survey (such as reminder emails or any external communications push). This chart can be easily shared as a downloadable PDF with the survey title and description included. A useful feature for communication such as a weekly report etc. Please note that only completed responses are displayed on the chart.
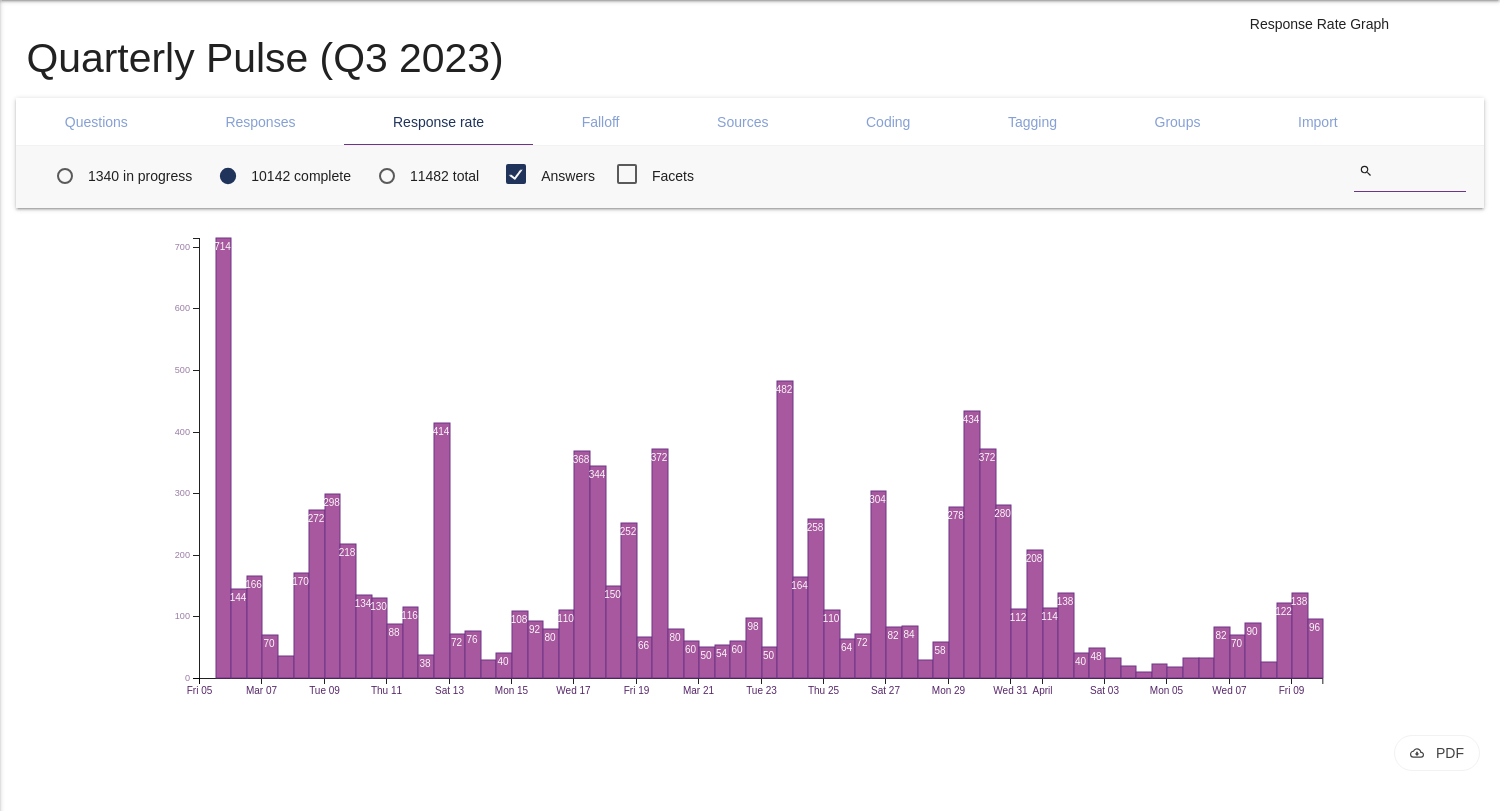
The Responses page will open on the Response rate tab by default when a survey is open.
Completion Report
The Completion report details completion rates against imported target rates such as organisational data like directorates and departments. By using prefilled-answers (imported), the Completion report will display responses listed by category (such as department for an employee survey) as well as their progress (partial, completed and target/total invited). This is useful for questions such as "how many of the finance department have responded to the survey?" and can be useful for identifying groups that are not responding to the survey which may need communications to encourage completion.
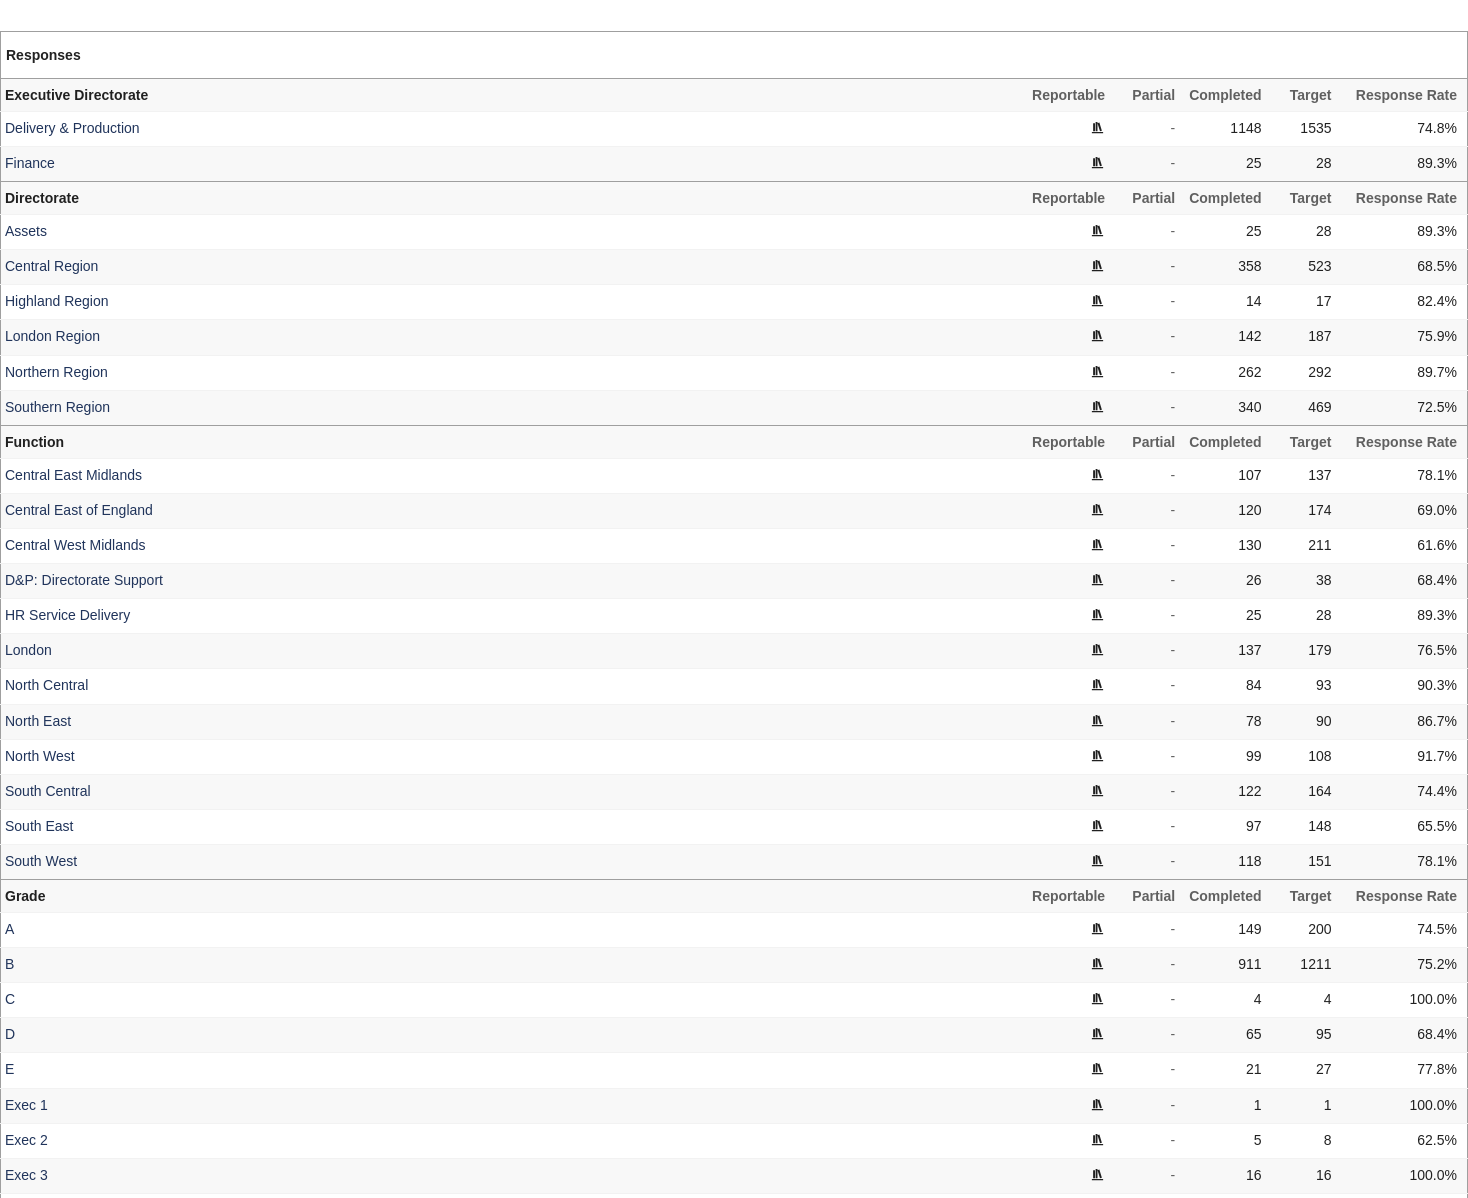
Clicking on a desired line will filter the table by that category or department/team. This report can also be exported as a PDF, CSV or copied to clipboard for communicating with stakeholders and exporting data.
FallOff
The Falloff tab contains a table displaying questions and a bar that represents the fall-off rate at the end of each section. This table reveals where respondents stop answering questions and can be used for optimising survey design; particularly useful for long surveys which are more prone to respondent falloff.
Sources
The Sources tab presents an overview of where responses have come in from. You will find information such as the number of responses that have come in from different url links, the browsers used and an indication of the type of device used to access.
Coding
The Coding tab is used for reformatting or grouping/ungrouping answers. A useful tool to simplify question answers for analysis.
As an example, your survey may ask "what type of job do you do", listing many different options. Using the coding tab, this list can be reduced into the key answers of your question such as "managerial", "office worker", "manual labour" etc.
You can also copy responses. For example, you may wish to copy a question and then copy its responses to the new question, enabling amending without risk of changing the original data.
Tagging
In the Tagging tab there is a tool to theme text answer choices using tags. Examples may include tags such as "positive" or "negative" sentiment, subject content such as about "salary" or "wellbeing". This can be a very helpful tool for analysis of text-based answers.
Import
The Import tab is used for importing responses into the survey. Useful for including historic data into your survey. This is also the tool used for importing a target file for prefilled-answer surveys.
You will find a [Coded CSV] button in the Advanced Exports box. This can be used for exporting survey responses for third-party analysis. Responses can also be exported to another survey. This can be a useful feature when combining responses from multiple surveys for analysis.
Deduplicate
You may have multiple surveys collecting similar data. In the Deduplicate tab you can include them all and compare. This tool can be used to see if a respondent has already been included in another survey, so you know not to contact them again.