Explainer: Dynamic Report Page
The Dynamic Report page is one of the pages found under the Reports page. The Dynamic Report page enables you to review and analyse your response data on a question-by-question basis. You’re initially presented with a graph for each question showing summarised answer data. Using the features on the page, you can show, hide, filter, compare and analyse your data in a variety of ways to begin gathering insights from your survey.
Once your survey receives its first response, the [Report] button will appear on the Survey tile on the Surveys page. This button will bring you directly to this Dynamic Report page. Alternatively click on the Reports tab and select the desired report.
Introduction
The Dynamic Report lists the questions and sections of the survey, in the same order as set up in the survey editor. The survey title is displayed at the top of the page, with response totals shown beneath. Below is an example of what you will see when first arriving on the Dynamic Report page.
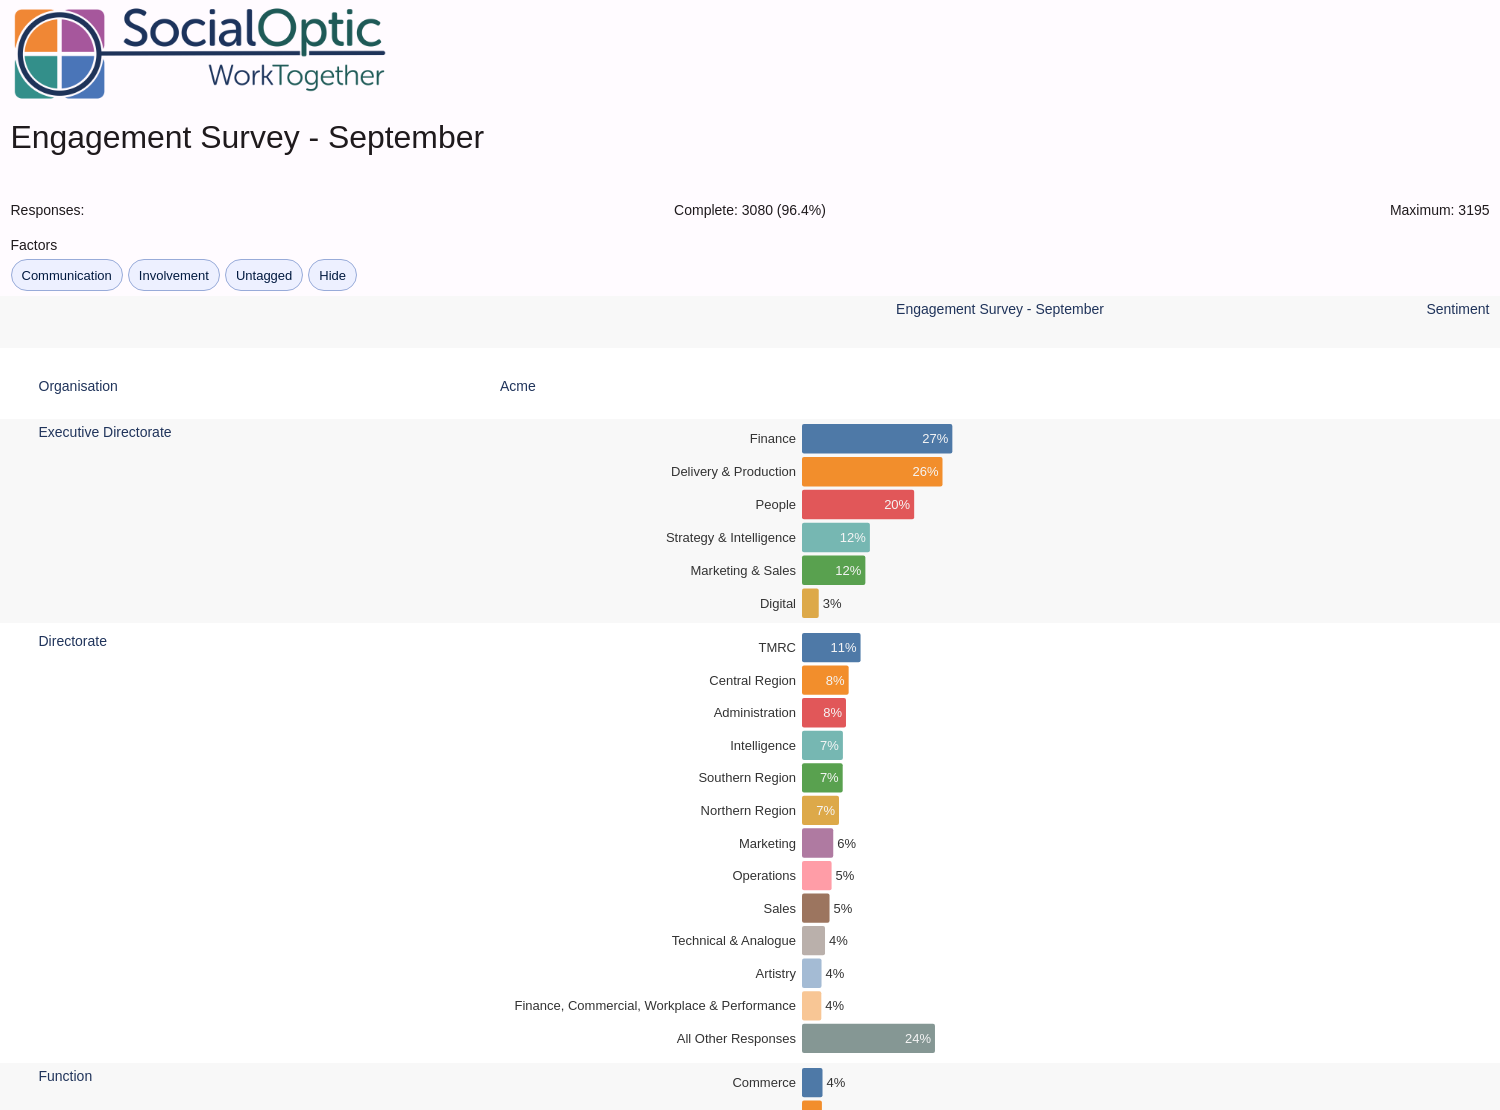
Each question is listed with an appropriate graph displaying the results of the response set along with scales and legends to describe what is being displayed. Graph types are automatically selected based on the question type, to display data in the most appropriate format.
Report Types
Short and long text question types are displayed as a word cloud. The word cloud displays the most frequently words used. Higher frequency words are displayed as larger in size. Word clouds are designed to give an at-a-glance view of the text responses.

Multi-choice, Multi-choice coded, Multi-select and Dropdown list question types are all represented by bar graphs that look like the below. Ordered by descending frequency.
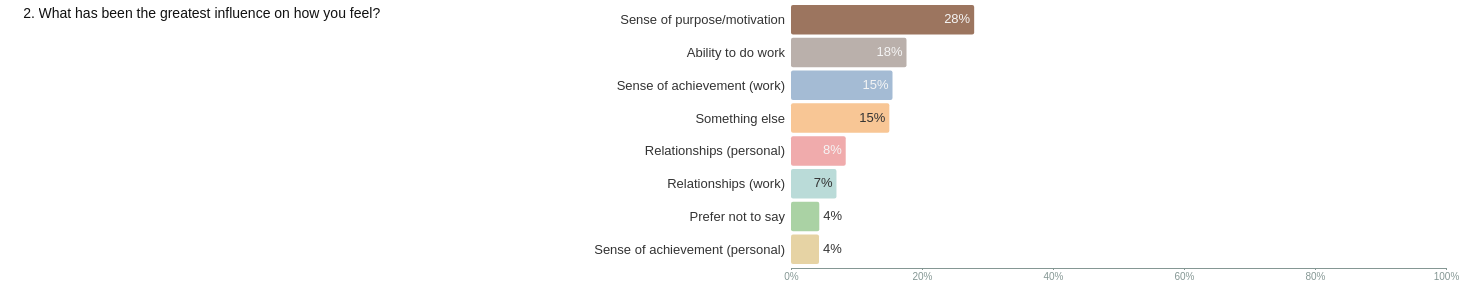
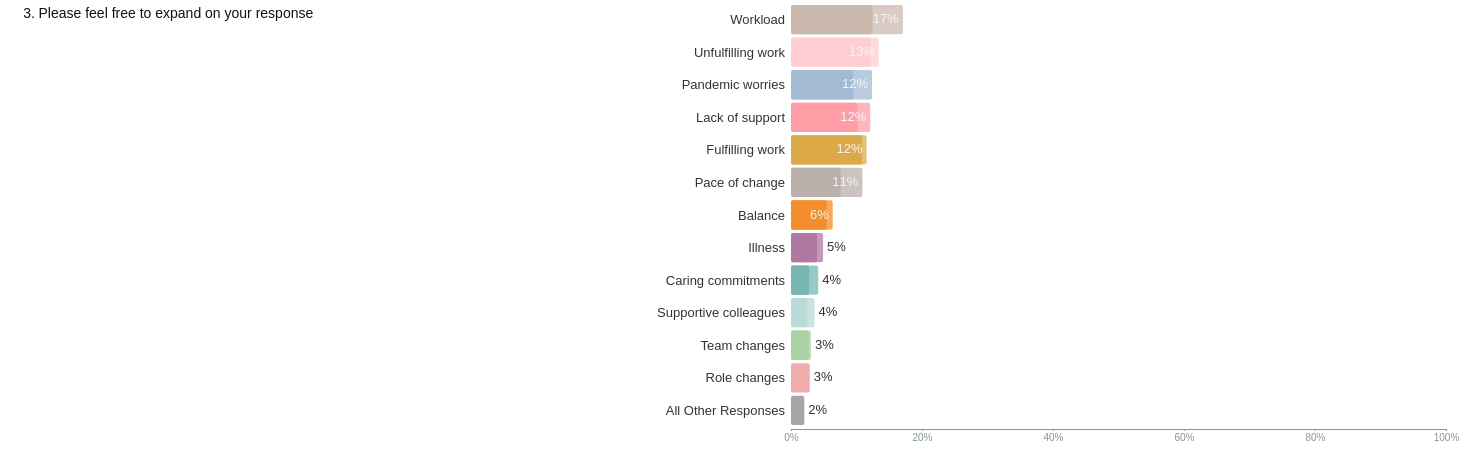
Where there are more answer choices in the question than can be displayed, those that have the lowest frequencies are rolled up into an "all other responses" field. This allows users to focus on the most important answer choices. Where the same choices appear in multiple questions in the report, wherever possible SurveyOptic will use a consistent colour for those choices to make graphs easier to understand.
Additionally, for multi-select questions where respondents are able to select multiple answers to a single question, this is represented by bar graphs that can use a bold and a faded version of the same colour for each choice. A bold colour represents an exclusive choice (i.e. the respondent did not select any other choices for their answer). A faded colour represents a mixed choice (i.e. the respondent selected multiple choices within their answer).
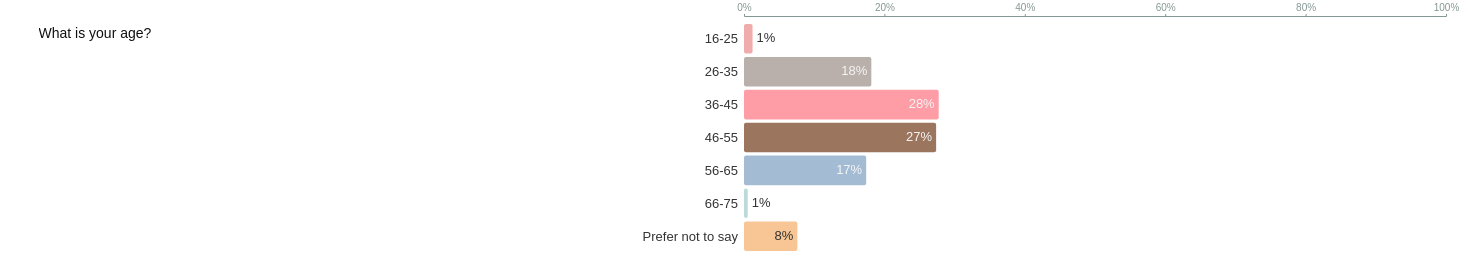
Some question reports are more easily understood when the answer choices are sorted by an alternative order. A good example of this is age. Questions which have been set as ‘ordinal’ on the Edit Survey page retain the order of the answer choices as set there.
Dichotomous questions (those with just 2 answer choices) are displayed as 1 bar with different colours denoting the 2 answer choices. This graph type is drawn when custom sentiment is used on a question with only 2 answer choices with different sentiment. Similarly, a trichotomous graph is displayed when custom sentiment is used on a question with only 3 answer choices, using positive, negative and neutral sentiment.

Likert scale questions use a similar graph style. They have positive sentiment displayed on the right hand side coloured in green, negative sentiment is displayed on the left, coloured red, and neutral sentiment is displayed centrally, coloured grey. Where a Likert scale question uses more than one choice for positive or negative sentiment, these are displayed using graduated shades of colour, with darker shades denoting a stronger sentiment.

Number, Decimal, Percentage and R-Scale slider question types and Scores are displayed as heat maps which also incorporate size. Greater opacity and size of bars indicate greater frequency.

Net promotor score (NPS) questions are displayed as a coloured heat map which also incorporates size to further represent frequency.

SurveyOptic will not ever report on individual responses to ensure the protection of anonymity. For this reason question types such as email and telephone number etc will not be displayed.
Reporting tools
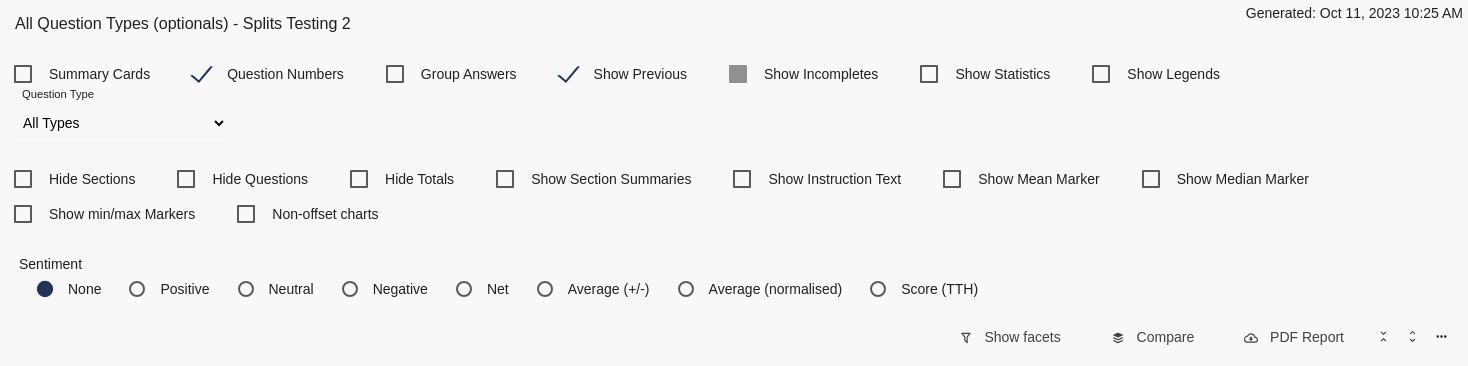
Clicking the three dots in the top toolbar opens up more options to customise your view of the dynamic report page:
Summary Cards - this provides a summary tile for each section of your survey. It will summarise the overall sentiment of each section. The title of each tile corresponds with the section heading on your Edit Survey page.
Question numbers - this will show or hide the question numbers.
Group Answers - group your results within each section by the answers, and not the questions. This is helpful if your survey contains section(s) which ask different questions, each with the same answer choices.
Show Previous - this will split the report area into two separate columns, allowing you to compare your current responses to another report. The comparison report will be shown on the left, and the current report will be shown on the right. Where a Previous survey has been set in the Edit Survey page, this survey will be shown by default. Alternatively, the other report can be chosen using the dropdown menu at the top of the comparison column.

Show Incompletes - this will show or hide incomplete responses in each question’s visualisation.
Show Statistics - depending on the question type, this will show or hide additional statistical data such as average, standard deviation, minimum and maximum values, and the number of responses to each question.
Show Legends - display legends for likert questions throughout the report.
Question Type - this will filter the Dynamic Report to display only the selected question type. To remove the filter, you should change the dropdown to ‘All Types’.
Sentiment - selecting a sentiment type here will display a column showing the selected sentiment type for relevant questions. This setting will also display sentiment change where comparable questions from a previous survey are included. Positive sentiment change of 5% or greater is labelled green with an arrow, negative sentiment change of 5% or greater is labelled redwith an arrow, and change of under 5% or neutral sentiment is labelled grey. Statistically significant changes are shown with a bold arrow. If a default sentiment type has been set in the survey editor, the dynamic report will display the default sentiment unless set otherwise. Read our guide on sentiment to find out more about the different sentiment types.

Hide Sections - this will show or hide section headings. The section headings are shown before the first question in a section and ‘stick’ to the top of the page when you scroll down within that section.
Hide Questions - this will show or hide the questions under each section, leaving only section headings.
Hide Totals - this will show or hide the response totals at the top of the page.
Show Section Summaries - this will show or hide a summary graph for each section.
Show instruction text - this will show or hide any instruction text given in the survey.
Show Mean Marker - this will show or hide a mean marker on relevant question types.

Show Median Marker - this will show or hide a median marker on relevant question types.
Show min/max Markers - this will show or hide minimum and maximum markers on relevant question types.
Non-offset charts - display non-offset likert charts instead of the default offset graphs for an alternative view. When Non-offset charts is turned on, the charts will be displayed from 0-100% instead of positive/negative sentiment being split either side of 0%.
Sizing buttons - change the display size and detail shown on the graphs. From short to expanded views. Where choices are rolled-up into an 'All other responses' bar, expanded views will reveal more of the choices. Shrinking the view will roll more choices up into the 'All other responses' bar. When viewing a split report, shrinking to the smallest view will change the normal graphs out for coloured dots, representing the highest frequency choice.

PDF report - generate a PDF report of the current view in the Dynamic Report page.
Compare - displays a survey picker just before the first question/section facilitating a choice of surveys to compare against.
Show Facets - activate the facet filter menu (see below "filtering" section).
Factors - if the survey is set up with ‘factors’, they will appear under the toolbar. You can select a factor and this will filter the report to display only questions tagged with that factor. Select the factor again to clear the filter.

Factors can also be found underneath question text of the relevant questions. Again the lozenge can be clicked to filter/clear filter.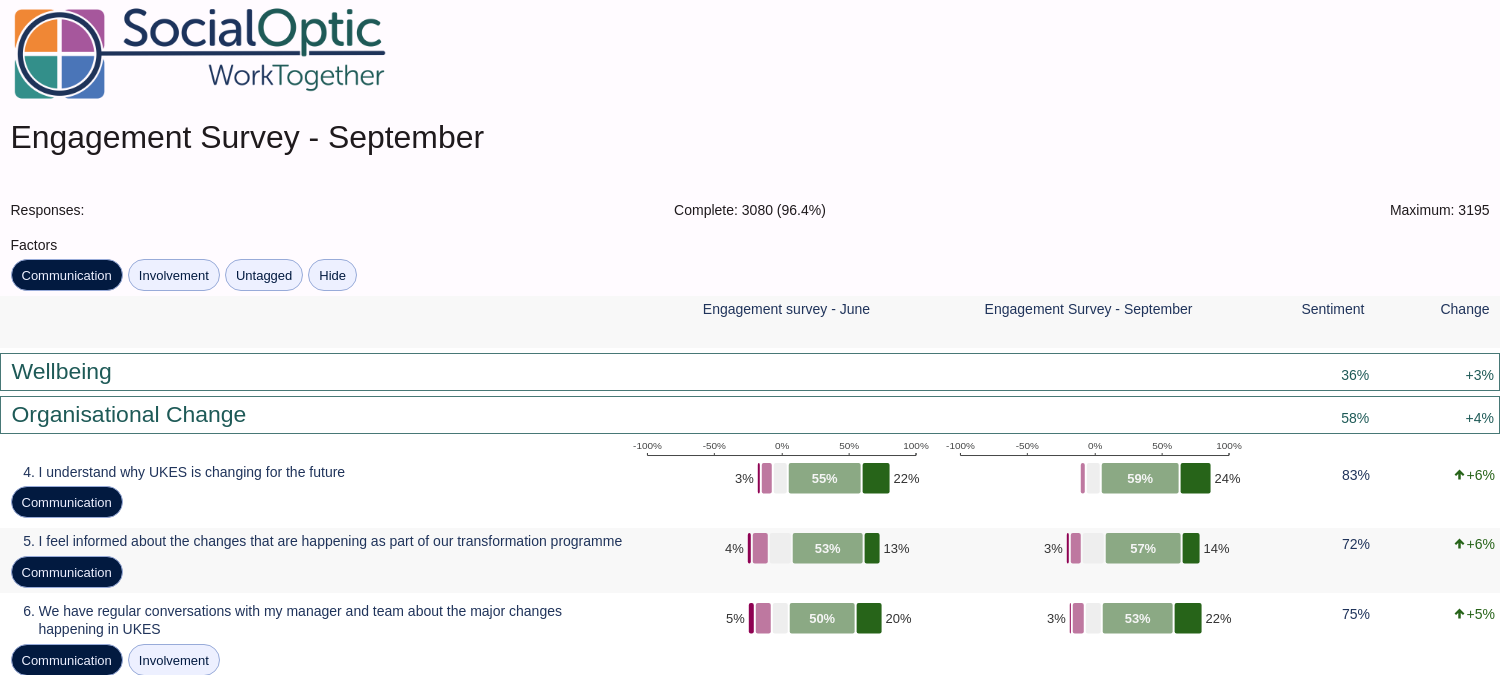
Other tools
Hovering over a question or section reveals a [hide] button. Use this to hide the selected question or section heading from view. Section headings also have a [hide section] button which will hide the entire section from view when used. These tools can be useful when creating reports for different audiences or purposes, focusing on the most pertinent data. When there are hidden items in your dynamic report, the [show all questions] button will appear in the toolbar, use this to return any hidden items into view.
You can hover over items in your visualisation in order to see further information about them. For example the answer choice, and its corresponding number and percentage of responses.
Clicking on a bar labelled 'All other responses' will expand the graph to reveal more of the choices.
After any section headings, you will also find a section for Scores and Factors, if these are present in your survey. These will allow you to filter to just scored questions or factor summaries.
You will find section filters at the bottom of the page. These will only show questions from the selected section, allowing you to focus on one section at a time. Select the [X] button on the highlighted section to return to viewing all sections.

The [download csv] button is also found at the bottom of the page. This will download the currently displayed dynamic report as a CSV file (not including any text questions).
Filtering
There are several ways to filter the data within the dynamic report page, allowing users to 'drill down' on certain groups and experiences to discover trends within a response set. These include:
- Click or Question Answer filter
- Use [Split] from a question visualisation
- Use Facets from the toolbar
Once you’ve selected your filter, please give the system a few moments to regenerate the information on the screen.
All 3 ways of filtering can be used at once, facilitating a variety of analytical approaches.
Each survey is set up with a reporting threshold. Where filtering causes the responses in an answer choice or group to fall below this threshold, SurveyOptic will mask the data to protect anonymity.
Question Answer filter
Clicking on one answer from a question’s visualisation will filter down all other question visualisations to only the people that responded this way to your chosen question. The response totals at the top of the page will show additional Filtered totals, detailing the number of responses being viewed with the current filter options.
In this example, Strongly Agree has been clicked to the question 'I understand why UKES is changing for the future'. You are now able to see how people who strongly agreed with this statement responded to the other questions.
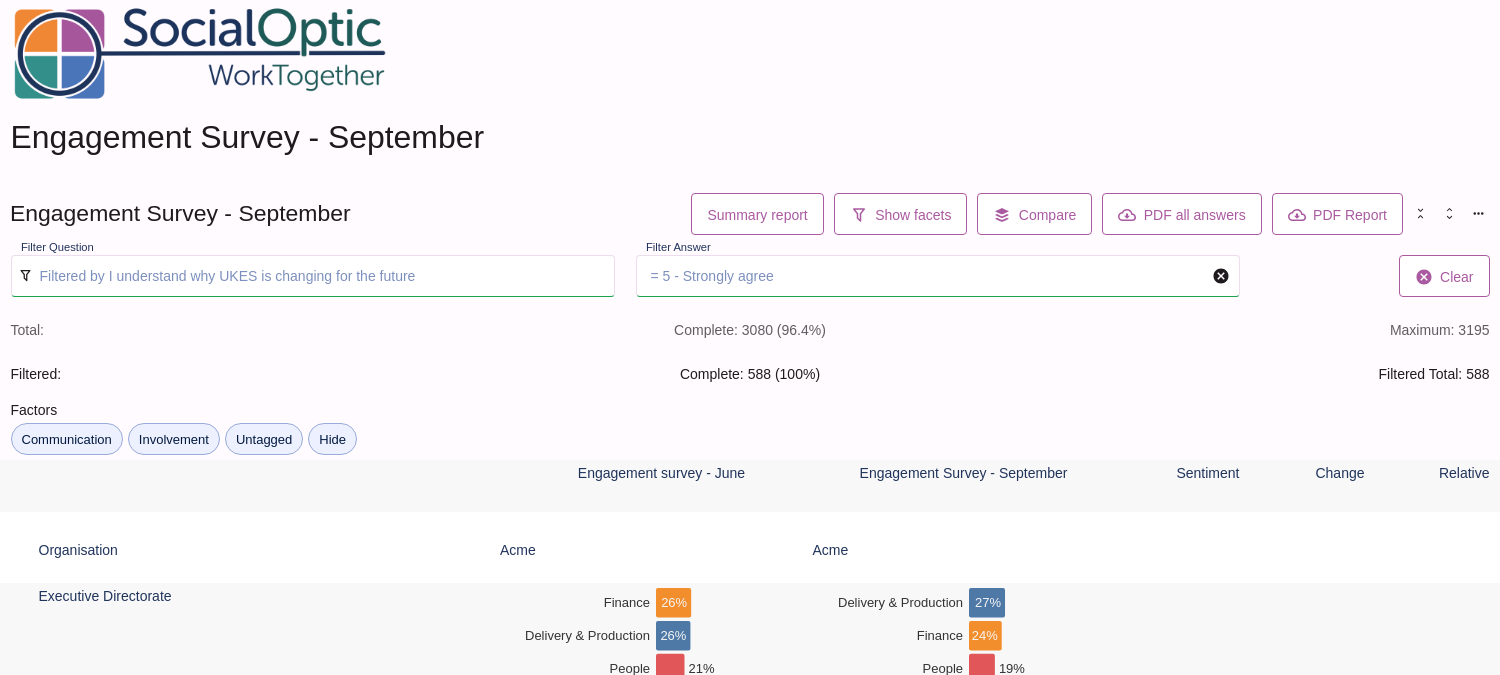
When filtered in this way, the toolbar will display a [pdf all answers] button. Clicking this button will download a pdf of the dynamic report for each of the available answers to the filtered question. For example, click filtering an "age" question and using the [pdf all answers] function will download a pdf report for each age group.
When filtered in this way, the toolbar will now show a [PDF all answers] button. Clicking this button will download a PDF of the dynamic report for each of the available answers to the filtered question, in turn. For example, filtering a survey on one specific age group within a question and using the [pdf all answers] function will download a PDF report for each age group.
You can clear this filter by clicking [Clear] in the Filter Question bar.
Split filter
Alternatively, if you hover over a question, you will have the option to [Split] the report by this question.
In this example, responses have been split by “Executive Directorate”, and results have been displayed side by side. It is now possible to see whether Executive Directorate is a determining factor in the way that any given question has been answered. The dynamic report will mask columns where there are not enough responses to report. You may wish to use Show Legends in this view to reveal more label detail.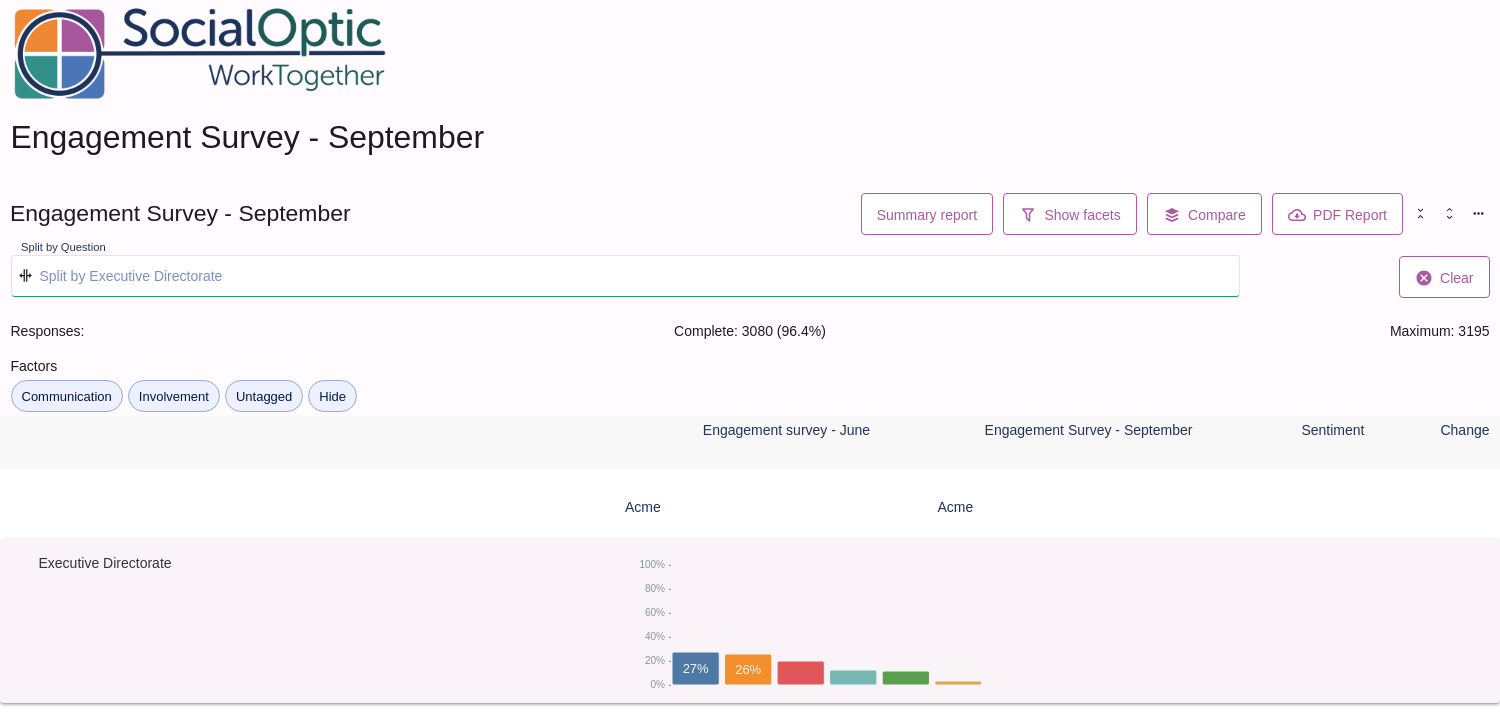
You can clear this filter by clicking [Clear] in the Filter Question bar.
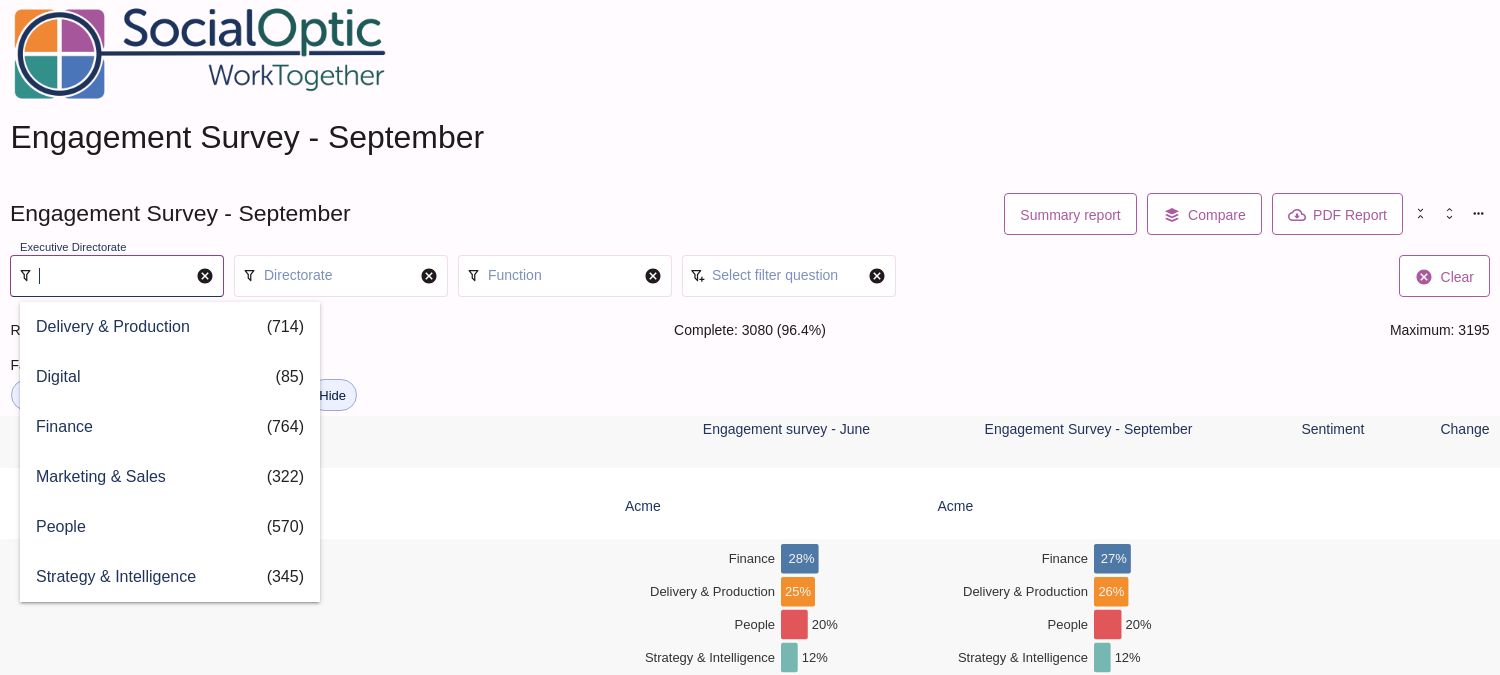
Facet filter
Like selecting one answer choice from a question visualisation, facet filters will filter down all other questions to only show the responses to your chosen question which match the chosen answer. The Dynamic Report page supports multiple facet filters to be layered on top of one another, allowing for targeted analysis.
Select the [Show facets] button to open the facet filter menu. Selecting the [Add] button will add an empty facet filter. Clicking on the facet filter opens a dropdown containing the survey questions. Select a question, then click on the filter again to select the desired answer choice.